> ## Documentation Index
> Fetch the complete documentation index at: https://docs.chief.bot/llms.txt
> Use this file to discover all available pages before exploring further.
# Generating charts & visualizations
> When an answer contains numbers worth comparing, Chief can turn them into a chart you can read at a glance and drop into a report.
When an answer contains numbers worth comparing, Chief can turn them into a chart you can read at a glance and drop into a report. This article covers generating data visualizations specifically — bar charts, pie charts, infographics, comparison tables, and word clouds — and downloading them. For the full [Visualize](/help/creating-exporting/turning-answers-concepts-into-visuals-charts-infographics-word-clouds-mind-maps-timelines-visualize) picker, including images and flow diagrams, see the overview.
## Generate a chart from an answer
 1. Ask Chief a question whose answer includes comparable figures (for example revenue by month, or survey results by category).
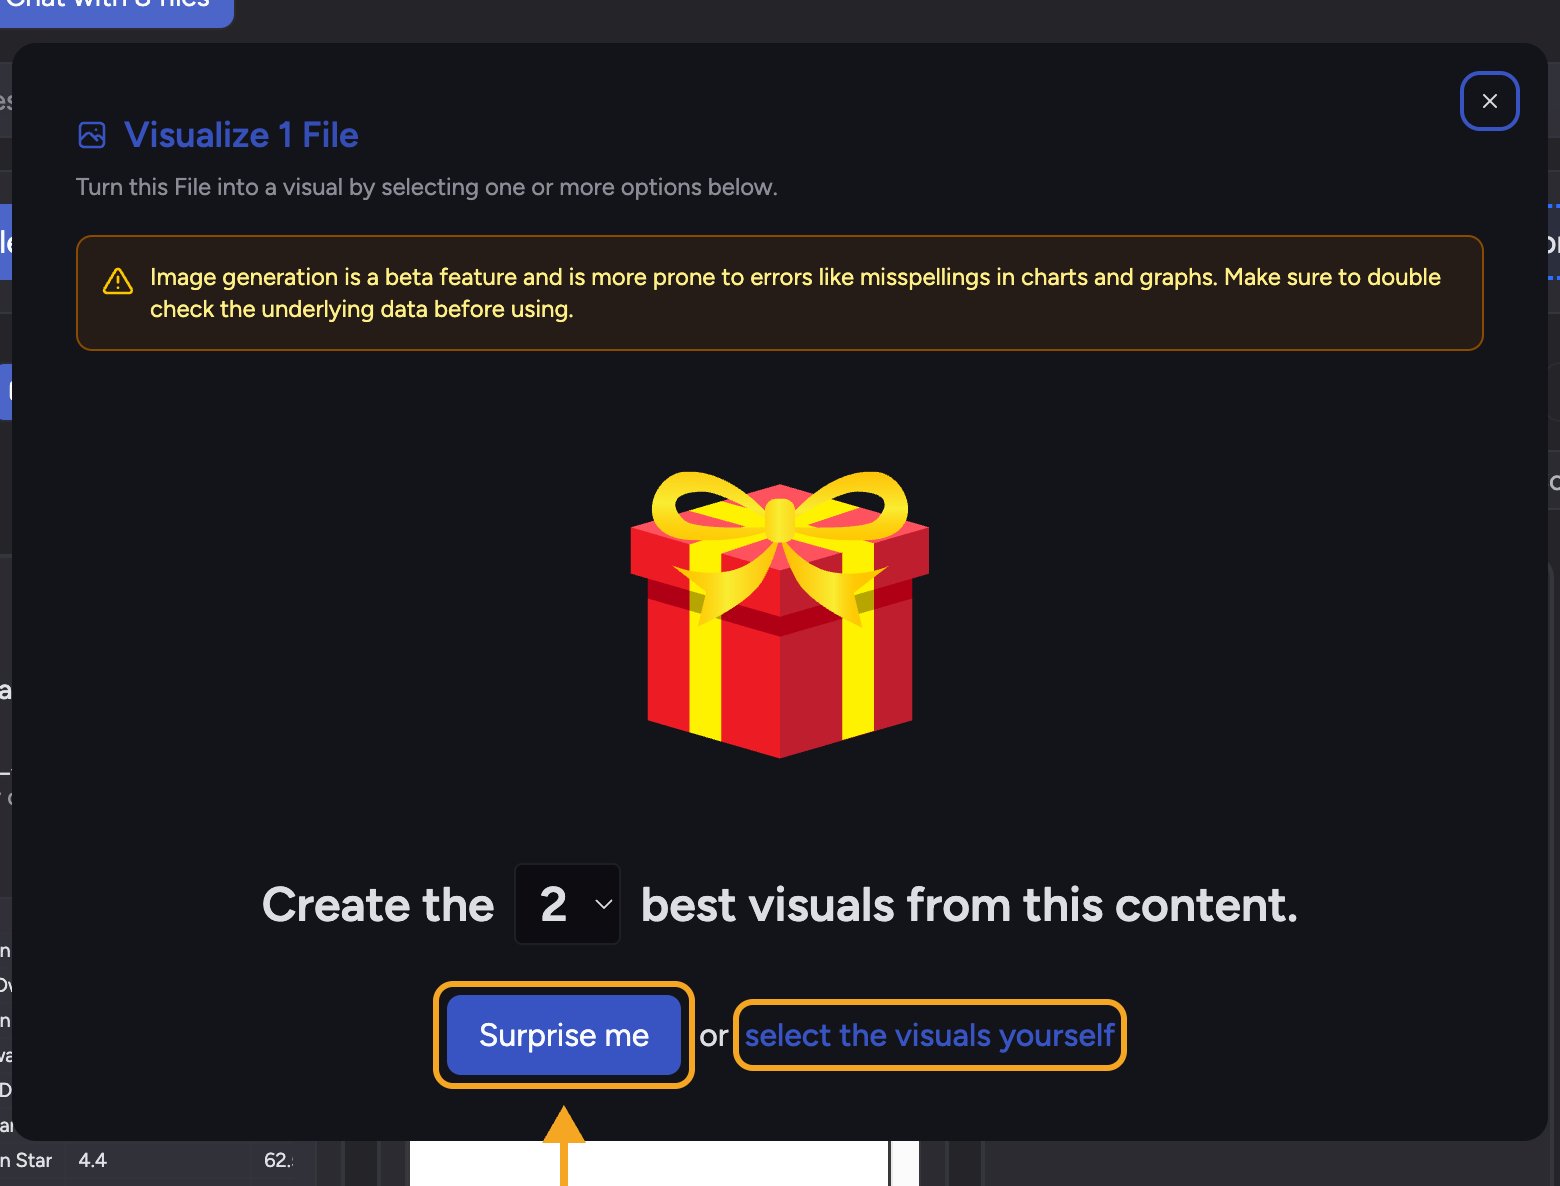
2. When the answer finishes, open [the response menu](/help/chatting-with-chief/working-with-an-answer-the-response-menu) and choose **Visualize this answer**. (You can also Visualize a File or a [Concept](/help/concepts/what-are-concepts) — the window that opens is the same.)
3. In the Visualize window, choose **select the visuals yourself**.
4. Under **Charts & Data Visualizations**, click the chart you want — **Bar Chart**, **Pie Chart**, **Infographic**, **Comparison Table Graphic**, or **Word Cloud**.
5. Click **Go**.
Chief reads your data and builds the chart, then lists it under **Created Files** in the answer. Click the chart to open it in a panel, titled and labeled from your data.
## Pick the right chart
1. Ask Chief a question whose answer includes comparable figures (for example revenue by month, or survey results by category).
2. When the answer finishes, open [the response menu](/help/chatting-with-chief/working-with-an-answer-the-response-menu) and choose **Visualize this answer**. (You can also Visualize a File or a [Concept](/help/concepts/what-are-concepts) — the window that opens is the same.)
3. In the Visualize window, choose **select the visuals yourself**.
4. Under **Charts & Data Visualizations**, click the chart you want — **Bar Chart**, **Pie Chart**, **Infographic**, **Comparison Table Graphic**, or **Word Cloud**.
5. Click **Go**.
Chief reads your data and builds the chart, then lists it under **Created Files** in the answer. Click the chart to open it in a panel, titled and labeled from your data.
## Pick the right chart
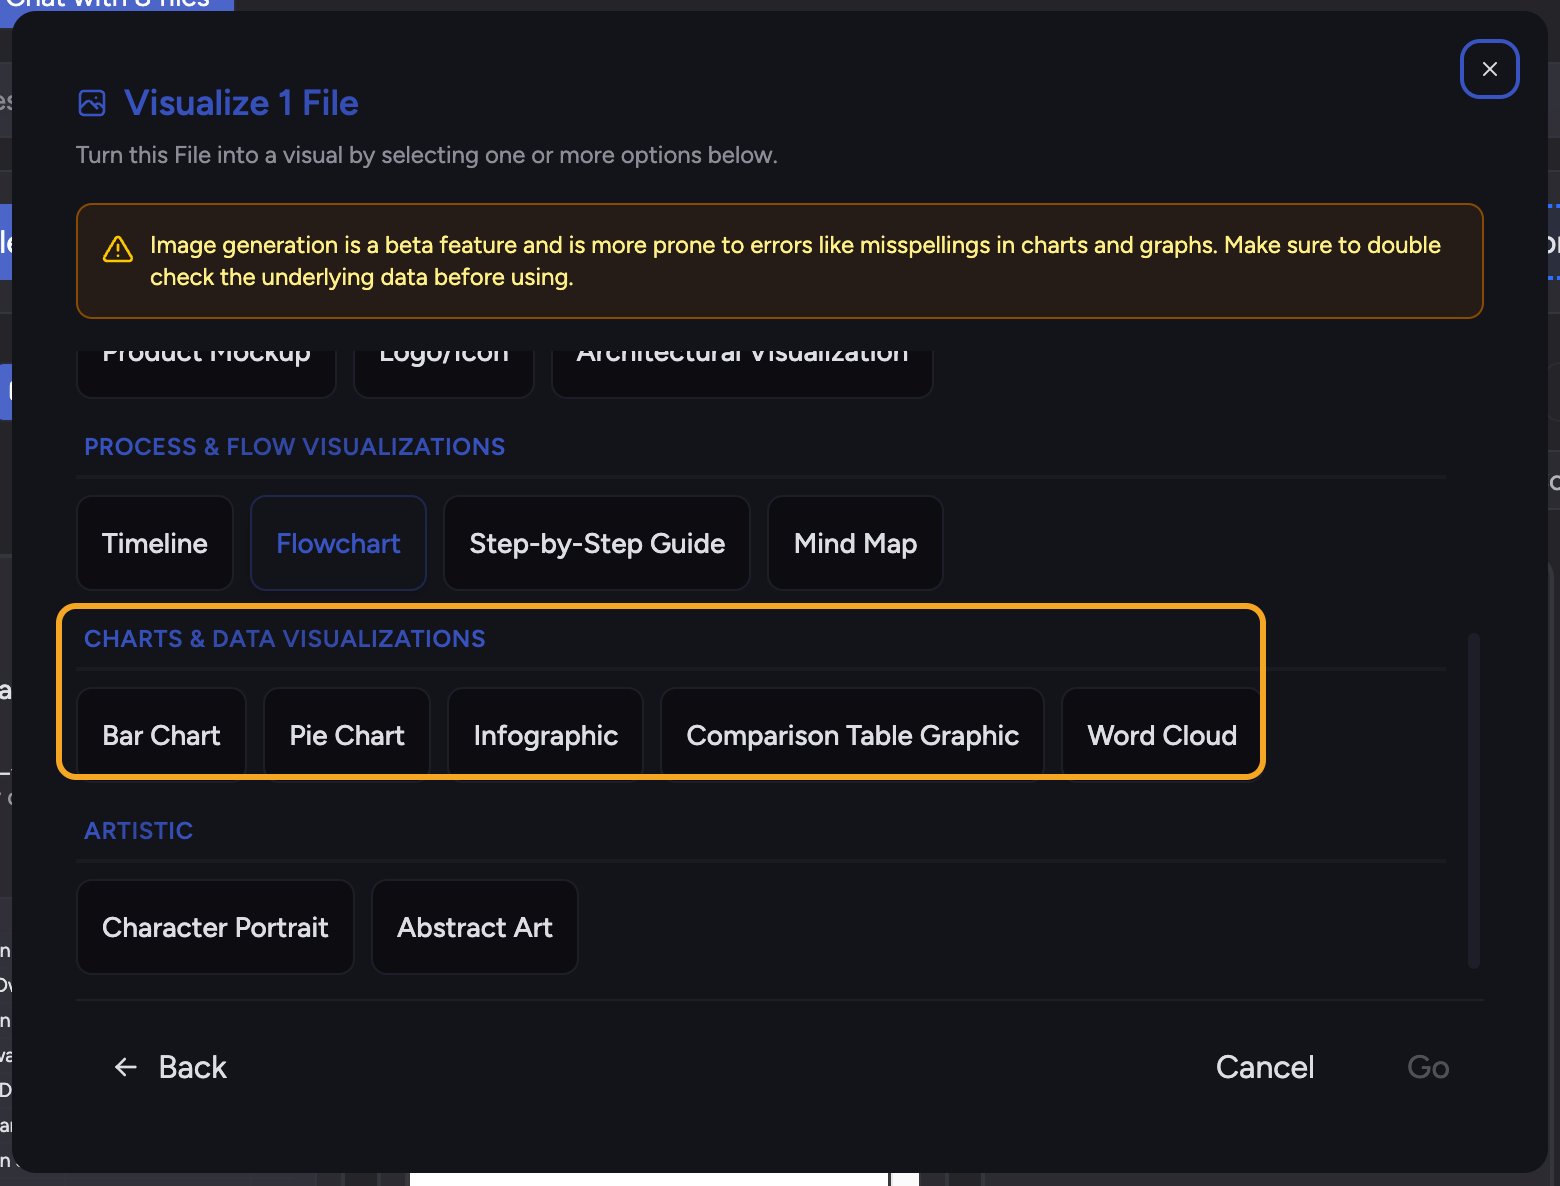 * **Bar Chart** — compare values across categories.
* **Pie Chart** — show how parts make up a whole (percentage distribution).
* **Infographic** — combine a few key stats with icons in a single graphic.
* **Comparison Table Graphic** — lay items side by side against shared criteria.
* **Word Cloud** — surface the most frequent terms in text.
## Download a chart
* **Bar Chart** — compare values across categories.
* **Pie Chart** — show how parts make up a whole (percentage distribution).
* **Infographic** — combine a few key stats with icons in a single graphic.
* **Comparison Table Graphic** — lay items side by side against shared criteria.
* **Word Cloud** — surface the most frequent terms in text.
## Download a chart
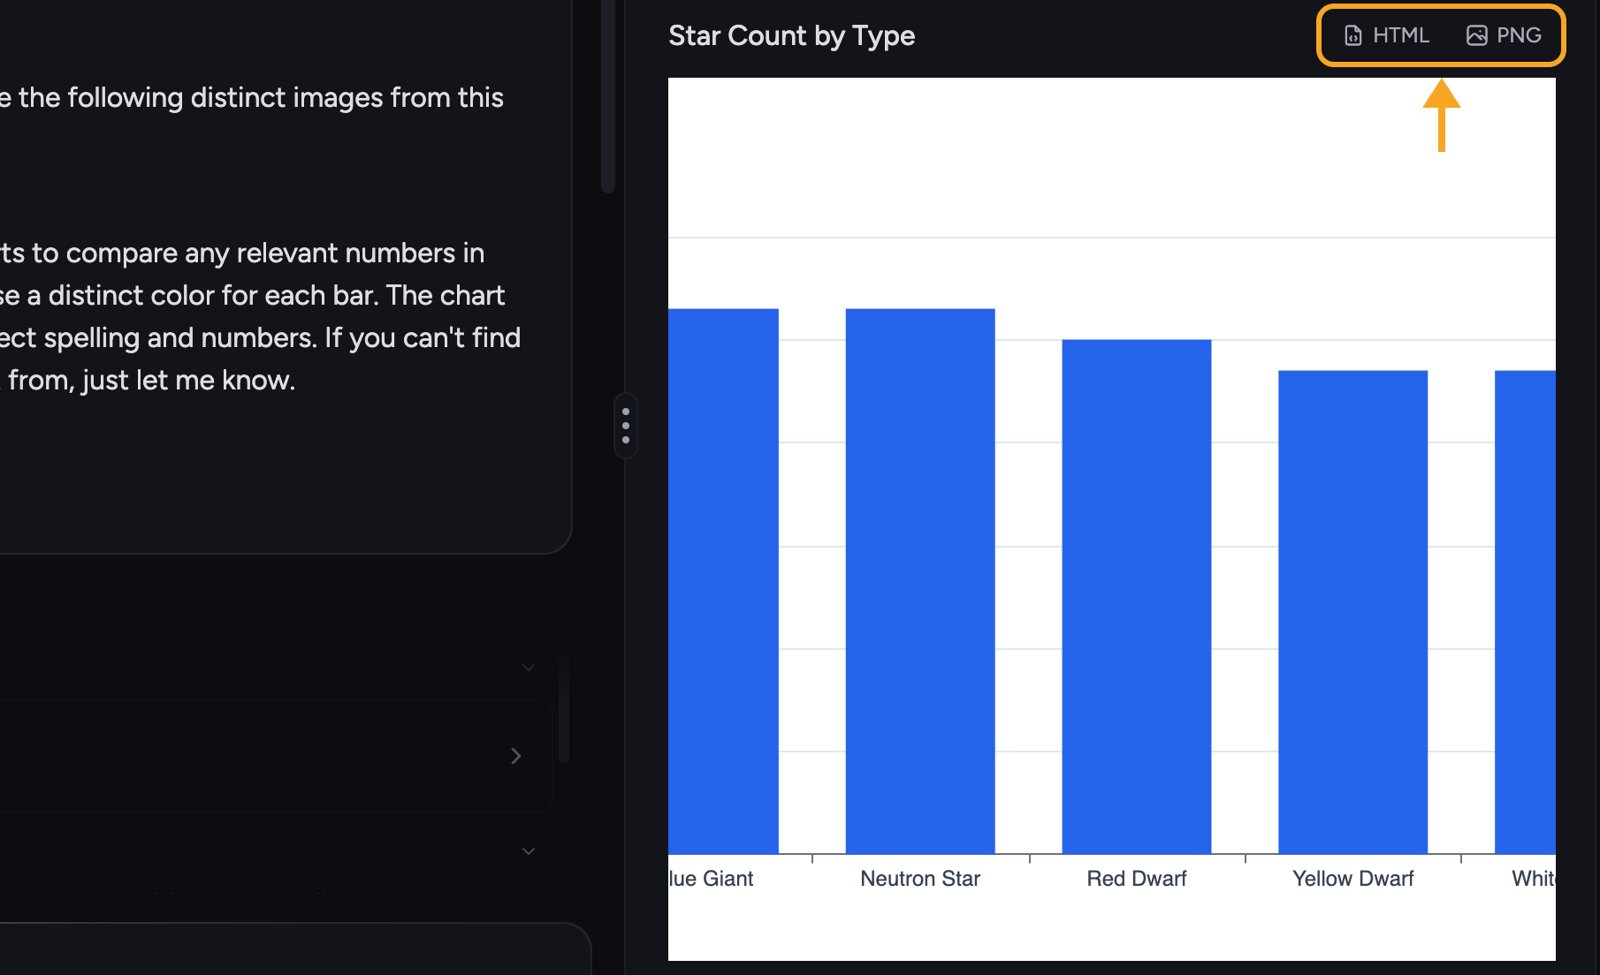 Open a generated chart to view it in its panel. At the top-right of the panel you'll find two export buttons:
1. Click **PNG** (**Download as PNG**) for a flat image you can paste into slides or docs.
2. Click **HTML** (**Download as HTML**) for an interactive version.
💡 **Pro-Tip:** Need several charts? Select more than one option in the Visualize window before clicking **Go** — Chief generates them in one pass instead of one at a time, and each arrives as its own File.
## FAQ
Bar and pie charts need [comparable figures](/help/how-chief-works-magic-under-the-hood/how-chief-processes-spreadsheets) in the answer. If the answer is descriptive only, there's nothing to plot — re-ask so the answer returns the values, then try again.
Always verify against the answer's underlying data. [Generated visuals are a beta feature](/help/creating-exporting/generating-images-beta) and can occasionally misrender a label or figure, so double-check before sharing.
PNG is a flat image, ideal for pasting into a deck or document. HTML keeps the chart as an interactive file you can open in a browser.
Open a generated chart to view it in its panel. At the top-right of the panel you'll find two export buttons:
1. Click **PNG** (**Download as PNG**) for a flat image you can paste into slides or docs.
2. Click **HTML** (**Download as HTML**) for an interactive version.
💡 **Pro-Tip:** Need several charts? Select more than one option in the Visualize window before clicking **Go** — Chief generates them in one pass instead of one at a time, and each arrives as its own File.
## FAQ
Bar and pie charts need [comparable figures](/help/how-chief-works-magic-under-the-hood/how-chief-processes-spreadsheets) in the answer. If the answer is descriptive only, there's nothing to plot — re-ask so the answer returns the values, then try again.
Always verify against the answer's underlying data. [Generated visuals are a beta feature](/help/creating-exporting/generating-images-beta) and can occasionally misrender a label or figure, so double-check before sharing.
PNG is a flat image, ideal for pasting into a deck or document. HTML keeps the chart as an interactive file you can open in a browser.