

Generate an image
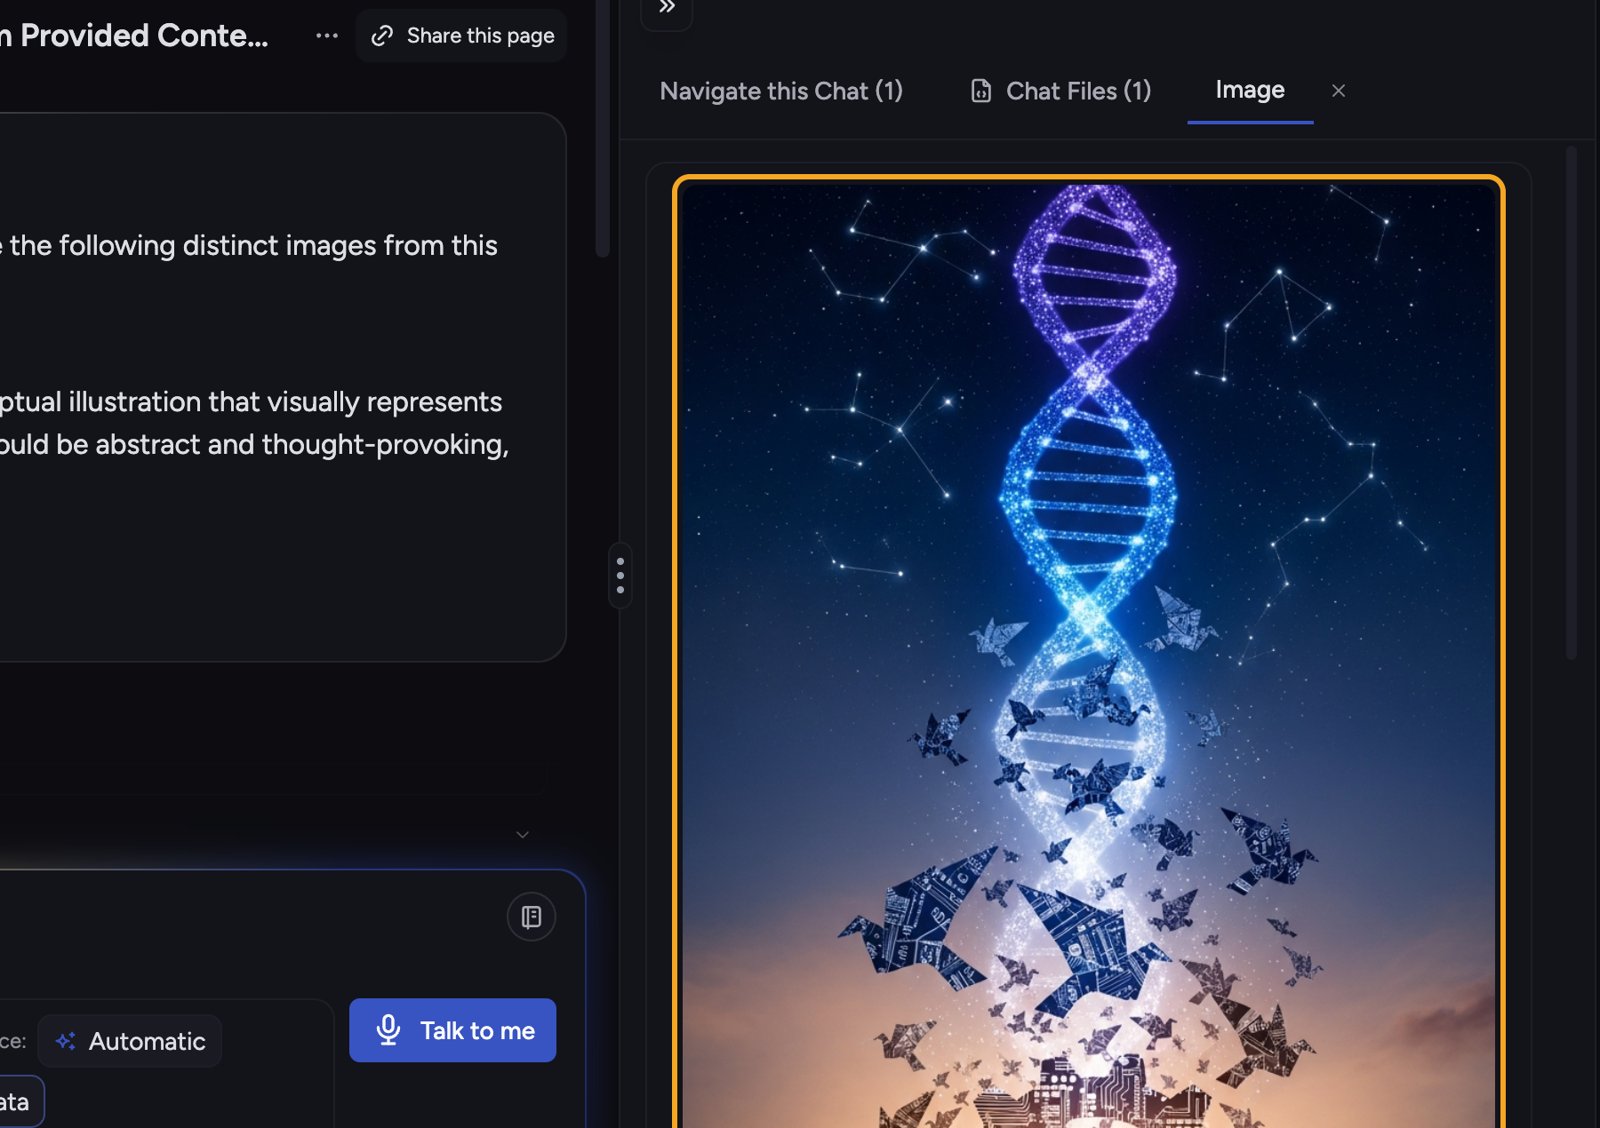
- Open the Visualize window from your content — on a finished answer choose Visualize this answer, or select a File in your Library and click Visualize. (Highlighting text and choosing Visualize from the Do more with this text menu works too.)
- In the Visualize window, choose select the visuals yourself.
- Pick an image option from a group such as Images & Scenes — for example Photorealistic Scene, Metaphorical Image, or Conceptual Illustration.
- Click Go.
What you can make
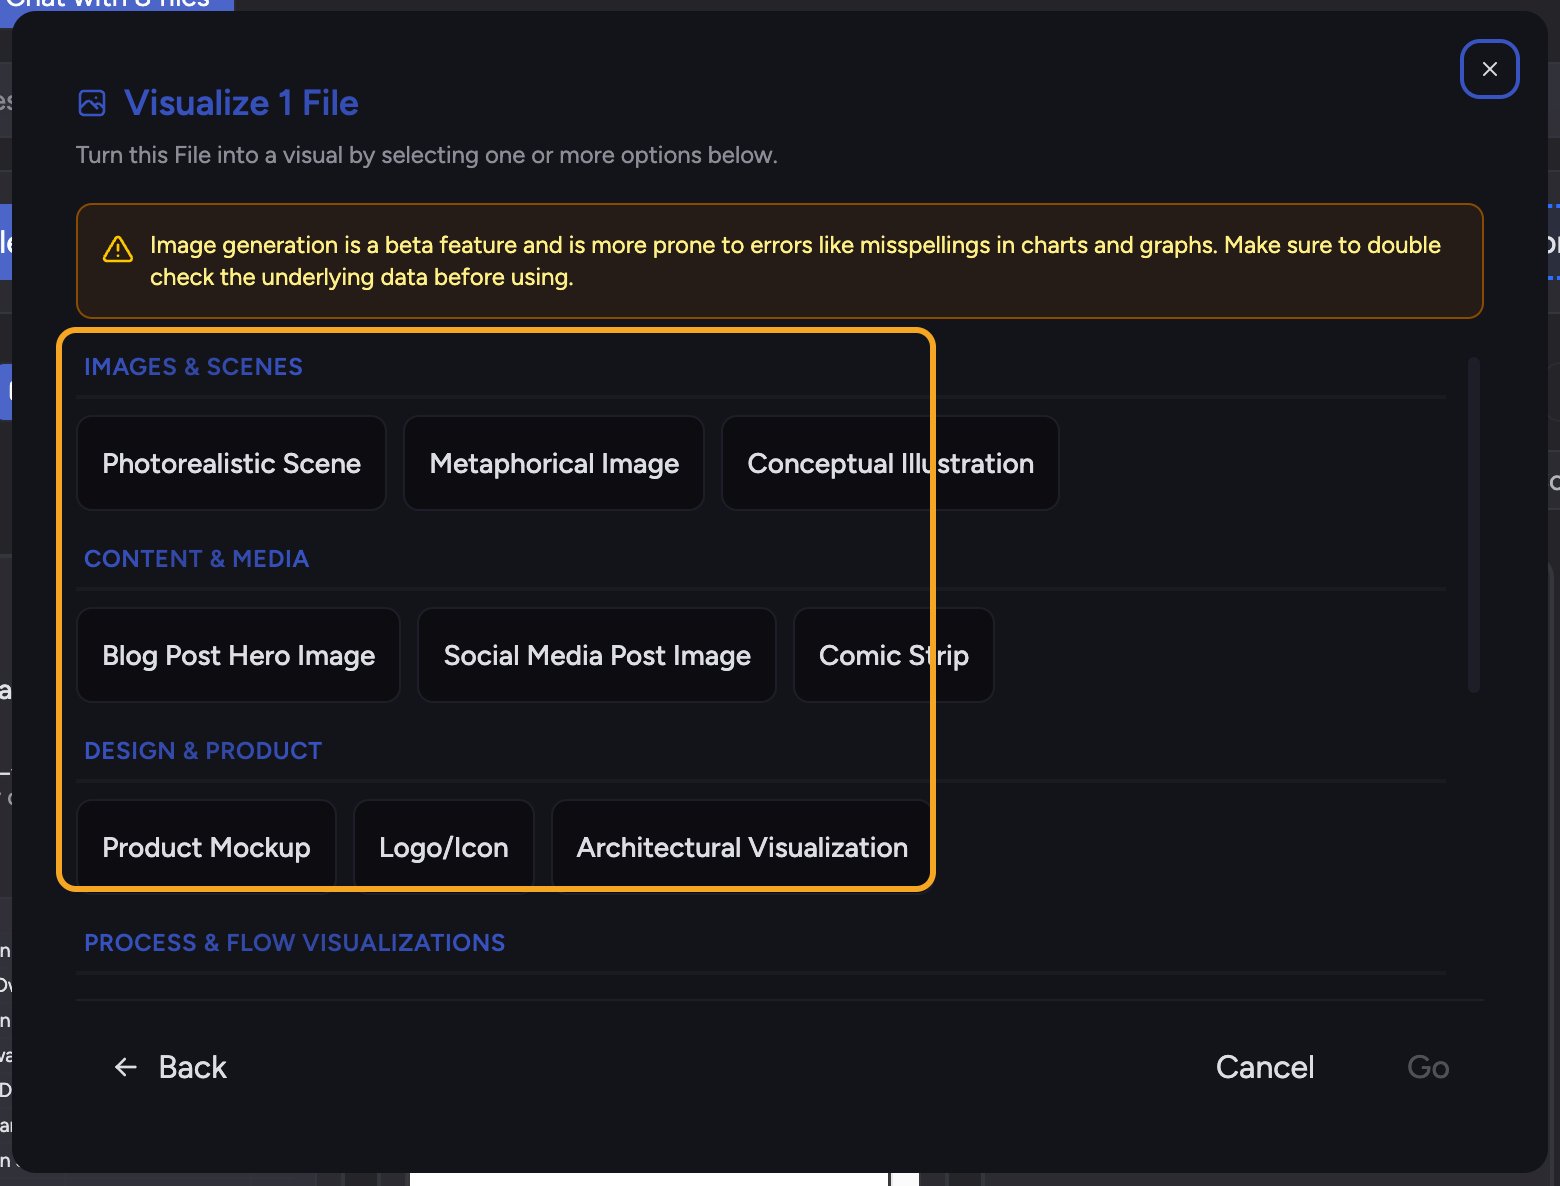
- Images & Scenes — Photorealistic Scene, Metaphorical Image, Conceptual Illustration.
- Content & Media — Blog Post Hero Image, Social Media Post Image, Comic Strip.
- Design & Product — Product Mockup, Logo/Icon, Architectural Visualization.
- Artistic — Character Portrait, Abstract Art.
FAQ
The image misspelled a word or got a number wrong.
The image misspelled a word or got a number wrong.
This is a known limitation of the beta. Generated images can misspell text and misrender numbers. Treat any text inside an image as a draft and verify it against your source before sharing.
Can I edit the image after it's generated?
Can I edit the image after it's generated?
You can regenerate by running Visualize again with a different option, or refine your prompt. For text-heavy content, a chart or document is often more reliable than a generated image.
Where do generated images go?
Where do generated images go?
Each one is created as a File, listed under Created Files in the answer. Open it to view it in a panel, download it, or keep it in your Project Library to reuse.